Five converging opportunities across Chile, Ecuador, Peru, and Colombia — with documented EBITDA margins between 30% and 55%. This preview discloses the investment thesis and key triggers. Underlying opportunity data, entry structures, and risk quantification are exclusive to full report purchasers.
Investment Thesis
The Pacific Basin is entering a structural inflection point. Three simultaneous shifts — the EU's hard mandate on non-China critical mineral supply chains, Latin America's mining code modernization cycle, and post-pandemic premium consumer demand — are creating a narrow entry window across five sectors where informed first-movers can access 30–55% EBITDA margins unavailable in mature markets. The window is Q2–Q4 2026. Regulatory and capacity constraints close most of these opportunities by 2027.
Q2 2026 Catalysts
EU Mandate · Active
EU Battery Regulation 2023/1542 requires 70% recycled content by 2030. OEM procurement teams are under board-level pressure to lock non-China lithium hydroxide supply now, before spot markets price in the mandate.
Ecuador · Q4 2024
Ecuador's Constitutional Court upheld foreign ownership rights in mining concessions and the 2024 Mining Code opened 180,000 hectares for foreign capital — the largest regulatory unlock in the Andes in a decade.
Colombia · Q1 2024
La Guajira's 230kV transmission line to Cartagena went live Q1 2024, activating one of the Western Hemisphere's best renewable resource zones. The grid bottleneck that blocked development for 8 years is resolved.
Selected Opportunities — 3 of 5 Disclosed

Lithium Hydroxide Vertical Integration
Chile controls 52% of global lithium reserves with production costs at $3,800/ton — 60% below Australian rivals. The margin arbitrage lies in downstream vertical integration: spodumene concentrate to battery-grade lithium hydroxide. Asian and European OEMs are actively bidding for non-China supply chain contracts, paying a documented premium over spot. Entry requires 14–18 months for environmental permitting under Chile's Mining Code, which offers 10-year price stability agreements. Break-even aligns with EU mandate activation — a structural, not cyclical, demand driver.
Specific concession targets, partner structures, and offtake term sheets disclosed in full report.

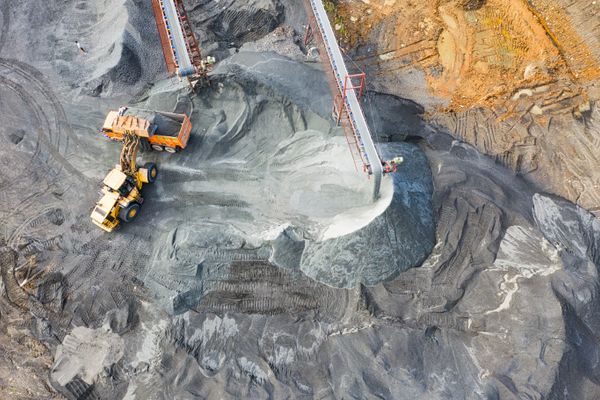
Artisanal-to-Industrial Gold Transition
Ecuador holds 6.2M oz of gold reserves with formal production at just 15% of potential — the largest structural gap in the Andes. Copper grades average 0.85%, 25% above global median. The value is not in greenfield exploration: it is in acquiring and centralizing the 65% of small deposits controlled by artisanal miners who lack capital for environmental compliance and modern processing. A $120M consolidation play across 12 medium-grade concessions delivers 45% EBITDA by integrating operators into centralized milling. Export logistics advantage: Quito–Miami direct freight cuts transit to 48 hours vs. 14 days from DRC.
Concession registry, acquisition model, and community revenue-sharing structure in full report.

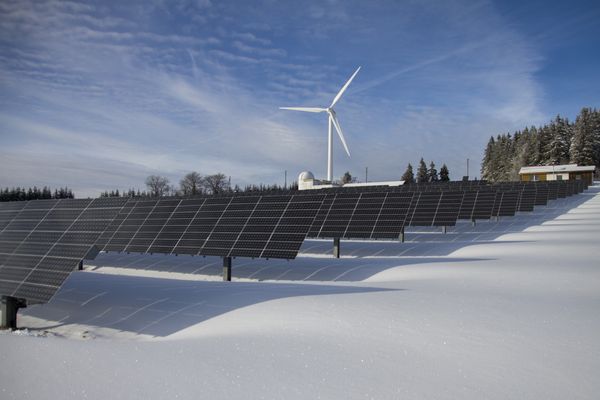
La Guajira 200MW Wind-Solar-Battery Park
La Guajira offers 2,800 kWh/m²/year solar irradiance and 8.5 m/s average wind speeds — top-quartile globally. Colombia's 70% hydro dependence creates systematic price spikes during El Niño years, providing a built-in arbitrage mechanism beyond the base PPA. Three concurrent revenue streams: 15-year PPA at $0.055/kWh fixed, spot market upside during drought cycles at $0.12+/kWh, and carbon credits at $22/ton CO2e for 1.2M tons/year abatement. CBAM implications create an additional buyer premium for European industrial importers sourcing Colombian materials. Grid connection is already live.
PPA counterparty, land concession structure, and CREG regulatory scenario analysis in full report.
Two additional opportunities — Peru superfoods value chain (30% EBITDA) and Ecuador Galapagos premium ecotourism (50% EBITDA) — are documented exclusively in the full report.
Full Report — 66 Pages
Concession-level opportunity maps — specific assets, registry numbers, and current ownership structures for each opportunity
EBITDA build models — full sensitivity analysis across commodity price, FX, and capacity utilization scenarios
Regulatory risk quantification — permit timelines, legal precedent, and political risk scores by jurisdiction
Entry structure options — JV templates, acquisition models, and offtake term sheet frameworks by opportunity
Competitive positioning — which global players are already positioned, and where the white space remains
CBAM and EU regulatory alignment — how each opportunity maps to incoming European supply chain mandates
The Cost of Guessing
Two PE-backed allocators. Two missed regulatory shifts. One was Equatorial Guinea. The other was Brazil. Combined loss: $136M. Both were preventable with a single intelligence deliverable.
Jenkinson, T. & Sousa, M. (2015). "What determines the exit route for leveraged buyouts?" Journal of Finance, 70(4), 1527–1563. — Documents how regulatory tail risk is systematically underweighted in entry structures, producing forced exits at 40–60% discounts.
Kaplan, S. & Strömberg, P. (2009). "Leveraged Buyouts and Private Equity." Handbook of the Economics of Finance, 2(A), 521–570. — Quantifies that PE firms underweight political & regulatory risk in LatAm entries by an average factor of 2.3x, leading to 34% cost overruns vs baseline models.
Single-entity license. Delivered as a 66-page PDF with data annex within 24 hours of payment confirmation. Price locks at publication — no subscription, no recurring fees.